Monthly Market Insight, April 2025

Introduction

One of the country’s most popular topics for discussion and a political vote-winner is “The Housing Market.” The problem is that there is no such thing. Instead, there are countless micro-markets: London, the countryside, flats, houses, detached, semi-detached, terraced – all moving in different directions at different times.

At GP Weston, we understand that the property market is not monolithic. Instead, we focus on hyper-local trends, particularly within South Somerset and North Dorset—our core areas of expertise. While we occasionally operate beyond these areas, this report is grounded in the regions we know best.

Scope and limitations

We also recognise the limitations of traditional indices. Most house price data, including that from the ONS, Nationwide, and Halifax, suffers from significant lag or limited coverage (e.g., excluding cash purchases or reporting only asking prices). A sale can take 2–4 months from offer to exchange, and an additional 3–6 months before appearing in the Land Registry data, meaning most price indices effectively report information 6–9 months out of date. Rather than focusing solely on house prices, our analysis tracks real-time market activity: the volume of new listings, sales agreed, and available stock. Combined with over 20 years of on-the-ground experience, this approach allows us to identify trends, anticipate market direction, and provide informed guidance to help clients achieve optimal results.

Like any analysis, we are limited by the quality of the data. While some properties are listed by multiple agents or agents manipulating the system by re-launching properties to make themselves seem busier,
we feel that the data set is big enough that these discrepancies are lost in the size of the pool and don’t impact the trends we observe.

Industry Overview

As touched on previously, there are many different indices, all quoting different results and measuring different things. Even using raw data from the property portals, without spending an unreasonable amount of time trying to clean the data, there will be double counts and false listings as agents try to make their “market share” look better to attract clients.

he main market reports quoted in the press are the Halifax and Nationwide house prices, the Office for National Statistics, and the property portals Rightmove and Zoopla.

Halifax and Nationwide report off the back of their respective mortgage applications, but do not consider cash purchases.

The House Price Index from the Office of National Statistics is based on actual prices paid as sales are registered with the Land Registry. There is a significant lag with this, though, because it takes 8-16 weeks for an offer to exchange and then another 3-6 months for the sale to be logged with the Land Registry. Thus, the HPI is reporting on what was happening in the market 6 to 9 months ago.

Lastly, Rightmove and Zoopla both issue market reports based on asking prices. The major flaw in these is that, firstly, very few properties sell at their asking prices, but more importantly, asking prices are invariably inflated by estate agents overeager to win the instruction, pandering to homeowners’ biased opinions. This happens more from December through to April/May as agents try to build a good register of properties to see them through the year.

Market Trends

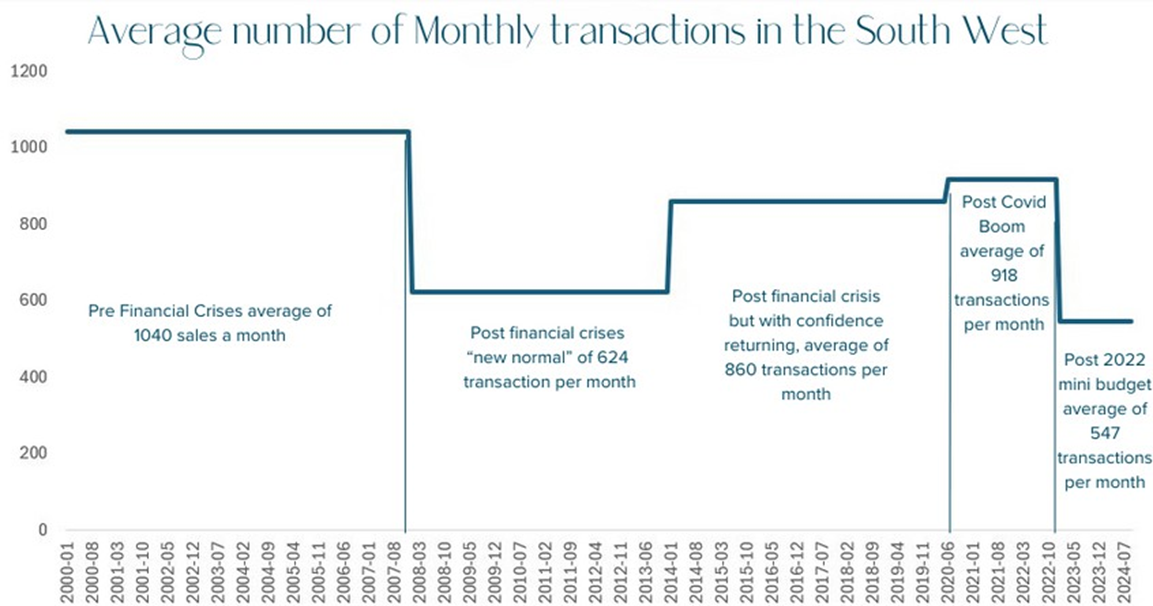
If you watch the market for long enough, you notice that the long-term trend for the property market is 7-8 years up (with the odd dip or plateau) followed by 2-3 years down. Fundamentally, this is because approximately 1.0m to 1.2m people move home each year. Most home moves are driven by necessity, and people can only put their lives on hold for so long (2-3 years) before all the factors that made them think of moving in the first place become unbearable.

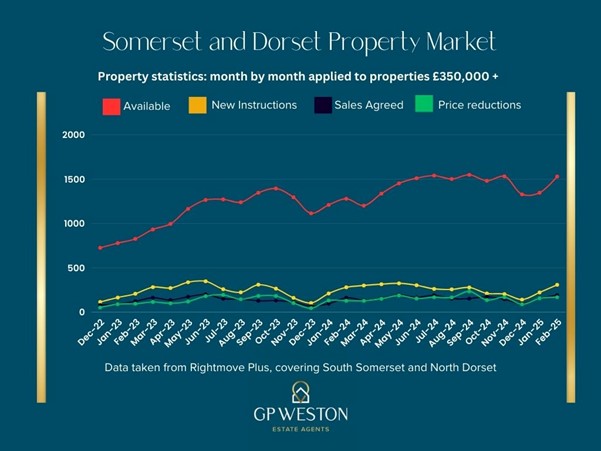
Inventory Growth & Buyer Behaviour

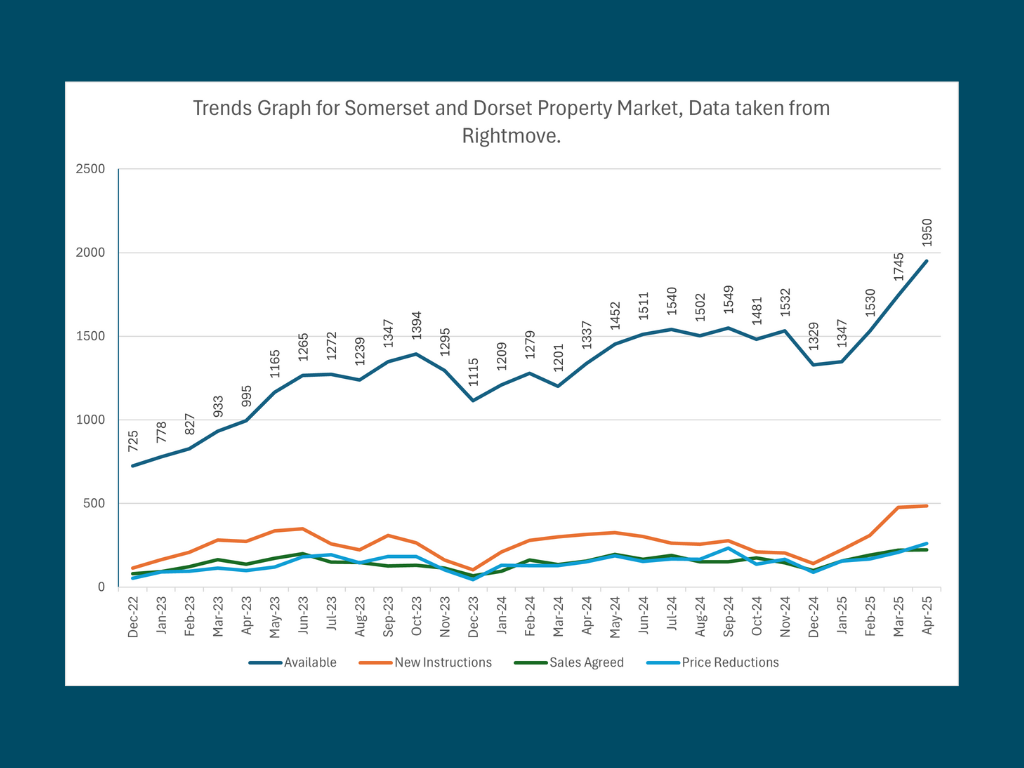
Since the end of the post-COVID boom and the “race for space,” the number of available properties has increased markedly—from 725 in December 2022 to over 1,900 in April 2025, representing a 171% rise. This supply growth is due to several factors: rising mortgage rates, increased taxation on second homes, and a return to office-based work, all of which have cooled buyer demand.

Sales agreed each month have remained consistent, aligning with the national average of 1.0–1.2 million annual home moves. However, the increasing supply has resulted in:

  • Downward pressure on prices, as sellers compete more aggressively for buyer attention
  • Longer time on market, as buyers have more choice and less urgency.

In this climate, accurate pricing, strong presentation, and proactive engagement are more important than ever.

Market Segmentation

We have said all along that we are less interested in nominal prices and more interested in demand and trends. The location dictates that the most common price points are between £200k and £500k. However, what we want to see is which price points have the greatest and weakest demand as measured by the percentage of properties either going under offer and/or being reduced in price.

With 17% of available properties being sold, the £200k to £300k price bracket appears to be most in demand, whilst at just 3%, the market over £2.0m is seeing the least activity. The market splits at the £500k mark, with the percentage of properties below that price point being agreed generally in double figures, and over £500k, it drops to single figures.

This pattern is likely expected with the tripling and quadrupling of interest rates on mortgage products from 2022 to the present. The higher the price point, the bigger the mortgage, and therefore the bigger the impact of rates going from below 2% to over 4%/5%. At lower price points, the increase in interest rates has a proportionately smaller effect.

As we saw with price points, geography also dictates that with the space afforded by rural living, there are not many one-bedroom properties. South Somerset and North Dorset are not constrained by congested urban spaces. Therefore, the majority of properties are three and 4-bed. Also, like the price points, the greatest demand is for these properties, with the percentage of properties with four or fewer, where statistics can sometimes raise anomalies with small sample sizes. Here we can see that one-bed properties are “most in demand” but in this case, we think it is just because there are only 22 available, so a mere three sales means that 14% of available one-bed properties went under offer.

Our third market breakdown was by property type. As one would expect from the previous two breakdowns, the space afforded by rural living means detached properties are the most common. What is more specific to South Somerset and North Dorset is that these two counties have the oldest average age meaning that bungalows are popular due to the accessibility provided by being on one level.

Again, the data is slightly skewed by the small number of flats, but one would expect that detached houses would be the most in demand. In our opinion, the lower price points of terraced houses minimise the extra cost of mortgages these days, thereby meaning that more of these are selling than detached homes through necessity rather than choice.

Conclusion

For the past 10 years, I have done a very similar report but on a more general basis. This is the first time I have broken the market down into property types, price brackets, and the number of bedrooms. For the sake of brevity and keeping the audience engaged, I have stopped here, but it is obviously possible to dig deeper. If anyone would like to discuss their property in more depth, I would, of course, be delighted to meet in person and go through the numbers.

Looking at the market as a whole, the headline figures show a 170% increase in available properties and an average of 11% of available properties going under offer. If you want to sell, then your property needs to stand out. Now that could mean standing out in terms of what it has to offer, bedrooms, land, condition, etc., but if it has nothing to make it stand out in those ways, then it will need to stand out in terms of price. Gone are the days of multiple buyers scrapping over every property the day it is launched.

It is well known in property circles that if you launch a property at a price that is too high and subsequently has to be reduced, it takes longer to sell and will eventually sell at a lower level than if it had been launched correctly at the start. This is for two reasons: 1) it could be following the market down, and therefore, for every day it is on the market, it is worth less and less. or 2) it is just consumer behaviour that if the property has a “reduced” label next to it on the various websites, then buyers worry there is something with it and offer cautiously.

If you would like to speak to us about selling your home we would be delighted to give you the benefit of our experience. You can call James on 07525 008 650 and Jessica on 07875 355 382, or email in at team@gpweston.co.uk.

Yours

James Weston

Monthly Market Insight, March 2025

Local Market Snapshot – A Data-Driven View

Each month, we track key market indicators in our local area: the number of available properties, new instructions, sales agreed, and price reductions. This gives us valuable insight into how current trends might:

  • Influence someone’s decision to list their home
  • Impact pricing strategies and market values
  • Affect how long it might take to sell
  • Help determine whether to price conservatively or ambitiously

We also compare our local data with national trends and use a range of industry sources to provide context and deeper understanding.

🏡 Available Properties

The number of properties for sale in Somerset and Dorset has surged to 1,745—the highest I’ve recorded since starting this research. That’s a stark contrast to 933 in March 2023 and 1,201 in 2024. This rise is being driven by the spring market finally gaining momentum, combined with a backlog of homes struggling to sell.

According to Rightmove, the average time to find a buyer in the South West is now 70 days—making it one of the slowest-moving regions. Only the East Midlands (71 days) and Wales (77 days) are slower. Compare that to 65 in London and 64 in the West Midlands, and it’s clear we’re in a more patient market here.

✍️ New Instructions

March brought with it sunshine—and a wave of activity. We saw 477 new instructions, the highest single-month (up from 348 in May 2023).

With only 220 sales agreed, the imbalance between supply and demand is growing, and more choice means buyers are taking their time.

🔑 Sales Agreed

Encouragingly, March saw the highest number of sales agreed since January 2023. But when you look at it in context—just 13% of available homes found a buyer—it paints a more cautious picture.

This suggests that while buyers are certainly out there, they’re selective. You need one of two things: either something truly special or the price has to be attractive.

📉 Price Reductions

It’s no surprise that we’ve seen a spike in price reductions. With some sellers entering the market in January or early February now adjusting expectations after 8–10 weeks of little movement. There were 209 price reductions in March, up significantly from 128 in 2024 and 114 in 2023. Still, that’s about 12% of the total stock, which suggests sellers are slowly recognizing the need for realism in pricing.

🗣️ On-the-Ground Insight

The feedback we’re hearing from fellow estate agents in Sherborne, and across the region, is consistent: the market is sluggish. It’s not just isolated to one location or one type of property—this applies across all price points.

I recently came across this article from a respected surveyor I used to work with, and it resonated:

The Worst Market in 30 Years? ~ The Expert Valuer
 
“A number of well-respected agents have told me in the last few months they believe it is the worst market in over 30 years. The only properties which are selling are with the right agent at the right price and there are very few agents who have the expertise to ‘make the weather’. Part of the problem is in the last few years the agency world has become fragmented, with many of the best agents leaving the big established firms and they have taken their clients with them.
 
Many years ago when I joined the house sales team of a certain blue chip partnership I was told they never normally recruit anyone under 30 and certainly never anyone from certain high street agents. Since then almost all the old school agents have disappeared to be replaced by young whipper snappers whose trousers tend to be as short as their manicured facial hair. This means many of the big firms have hardly anyone who remembers the doldrums of the early 90s or even the credit crunch of 2007/2009. This is a market where experience is vital and ‘grey hair’ is needed to navigate a shallow and very difficult market.”

The truth is, the agency landscape has changed dramatically in recent years. Many of the most experienced agents have left the larger firms, taking their loyal clients with them. Meanwhile, much of the newer generation hasn’t yet weathered a tough market like this.

💬 Let’s Talk Strategy

We know it can be disheartening when things don’t move quickly—but rest assured, it’s not just you. This is a broader, national issue. That said, smart decisions and the right team can make all the difference. If you’d like to explore the numbers more deeply, review your property strategy, or discuss when and how to make your move, I’d love to help. After all, when it comes to property, the numbers really do matter.

James Weston
GP Weston
Your expert Estate Agents in Somerset and Dorset


Monthly Market Insight, February 2025

Local Market Snapshot – A Data-Driven View

Each month, we track key market indicators in our local area: the number of available properties, new instructions, sales agreed, and price reductions. This gives us valuable insight into how current trends might:

  • Influence someone’s decision to list their home
  • Impact pricing strategies and market values
  • Affect how long it might take to sell
  • Help determine whether to price conservatively or ambitiously

We also compare our local data with national trends and use a range of industry sources to provide context and deeper understanding.

📈 Available Properties

The number of available homes has now climbed to 1,530, one of the highest levels since early 2023. For buyers, this means more choice—great news if you’re looking for family homes for sale near Sherborne or exploring luxury properties in Somerset and Dorset.

However, for sellers, increased competition means longer time on the market and downward pressure on pricing. It’s essential to remember that you’re not just listing a property—you’re competing with others who may be more flexible, motivated, or willing to negotiate.

🏡 New Instructions

Traditionally, estate agents in Somerset and estate agents in Dorset see a flurry of new listings around Easter, as sellers wait for gardens to bloom and longer days to showcase their homes. This year has broken the mould—February saw 308 new instructions, well above 280 in 2024 and 207 in 2023.

This early activity may be linked to sellers hoping to beat the stamp duty deadline—but in truth, many may have already missed the window.

🤝 Sales Agreed

Sales activity remains healthy. February recorded 192 sales agreed, an increase from 162 in 2024 and 122 in 2023. While that’s encouraging, it must be seen in the context of rising stock levels—the proportion of homes selling is largely unchanged year-on-year, and actually slightly lower than in 2023.

🔻 Price Reductions

Despite hopes of a spring bounce, 11% of properties saw price reductions in February (168 homes), mirroring last year. Early-year reductions are typically rare, but with buyers cautious and more stock on the market, realistic pricing is proving essential—especially in a competitive landscape.

🧠 On the Ground Perspective

From our position as active estate agents in Sherborne and across the wider region, we’re hearing the same story at all levels of the market—from those seeking luxury properties in Dorset to first-time buyers looking for family homes near Bruton.

The pace of the market feels slow. Buyers are often stuck, unable to sell their current homes, while the properties they’re interested in linger on the market. The result? Stagnation.

Part of the issue is persistent overvaluation. Sometimes agents over promise to win instructions, then hesitate to advise price reductions. But with so much property for sale in Dorset and property for sale in Somerset, realism is key. A small adjustment in price could be the nudge that frees up the whole chain.

📊 Let’s Talk Strategy

If you’d like to explore what this means for your own move—whether you’re planning to sell a luxury home in Somerset, downsize in Dorset, or buy a family home near Sherborne—I’d love to help. Analyzing the numbers and crafting the right strategy is what I do best.

Let’s talk about what works for you, not just what’s happening in the headlines.

James Weston
GP Weston | Your local estate agents in Somerset and Dorset

Monthly Market Insight, January 2025

Every month we chart how the number of available properties, the number of new instructions, the number of sales agreed and the number of price reductions in our local area.

We use this data to work out how the numbers could: –

  • Affect someone’s decision to put their property on the market.
  • Affect how prices could move.
  • Determine the length of time it may take to sell.
  • Influence whether to price conservatively or ambitiously.

We compare the local market to the national one and use articles from different sources to put meat on the bones.

AVAILABLE PROPERTIES: Due to homeowners wanting both their house and garden to look their best, the country market doesn’t usually take off until March at the earliest, but usually after Easter. However, in February 2025 we saw 308 new instructions compared to just 280 in 2024 and 207 in Feb 2023.  As I mentioned last month, this could well be people trying to catch those buyers rushing to beat the stamp duty but in my opinion, they have left it too late.

NEW INSTRUCTIONS: Similarly to the number of available properties, January 2025 saw a higher number of new instructions than the same month in 2024 or 2023. This could be due to sellers trying to catch buyers racing to complete before the stamp duty changes at the end of March. It could also reflect people no longer able to wait out the market and deciding to get on with their lives.

SALES AGREED: The start of the year saw a huge increase in sales agreed with 156 agreed sales in January 2024, compared to just 94 in January 2024 and 92 in January 2023. Like the New Instructions, this is probably due to a combination of wanting to beat the stamp duty deadline and buyers deciding the market has fallen enough and now was time to get on with it.

PRICE REDUCTIONS:  Year on year we saw an increase in price reductions in January. Sellers looking to tempt buyers who are wanting to beat the stamp duty deadline and properties over valued in the first place, sitting among an increased competition.

In my last market comment I wrote about how transaction levels coincided with global events. Over the last 20 years we have seen successive governments trying to prop up the housing market with various tax breaks. This has in turn seen the property market go through phases of increased activity followed by lulls in the market as buyers had rushed to meet various deadlines. Thankfully when this government took over, they resisted the urge to meddle in the market and the only thing on the horizon is the stamp duty threshold falling back from £250,000 to £125,000 where it originally was. This will result in a small increase of £2,500 for most buyers. Proportionally, this will have a bigger effect at the lower end of the market than the middle and upper ends.

In conclusion, the market feels stable with plenty of property for buyers to choose from. Buyers are accustomed to the level of interest rates and the consensus is that over time they will come down gradually. This alleviates any worry about decreasing affordability as well as the temptation to wait for a lower rate.

Since the market hit the brakes at the end of 2022, we have had 2 years of falling or static prices. Historically the long-term property cycle is 7-8 years up, followed by 2-3 years down. This means we should be at the bottom of the market and activity and prices should start to pick up and looking at sales agreed for January it suggests this may indeed be happening. As I have said before there is no single “PROPERTY MARKET” rather the market is doing different things in different regions and at different price points. Therefore, when considering whether it is a good time to sell, and what tactics to adopt, it is worth looking at the picture as a whole! For example, if you are thinking of moving to a better performing area, it is worth selling quicker before that market you are buying in to moves further away.  Likewise, if you are buying into a region where the market is falling away, then the longer you take to move, the bigger the difference in a positive way.

We pride ourselves delivering sound, honest advice, rather than merely trying to win business by cynically over valuing.

I hope the above has been of interest to you and if you would like to see the source data, discuss how the market might affect your move or when might be the best time sell, I would be delighted to talk to you. I enjoy nothing more than analysing the stats and figures with people. It is all about stats and figures when it comes to property!

Yours James Weston

Monthly Market Insight, November 2024

Every month we chart how the number of available properties, the number of new instructions, the number of sales agreed and the number of price reductions in our local area.

We use this data to work our how the numbers could:-

  • Affect someone’s decision to put their property on the market.
  • Affect how prices could move.
  • Determine the length of time it may take to sell.
  • Influence whether to price conservatively or ambitiously.

We compare the local market to the national one and use articles from different sources to put meat on the bones.

AVAILABLE PROPERTIES: Last month I commented on how the number of available properties had almost doubled over the last 2 years. By the end of November the number increased by another 50 taking the number of available properties over double (1532 compared to 725). This continues to push prices down gently and also means that properties are remaining on market longer as buyers have more properties to choice from.

NEW INSTRUCTIONS: 2024 has been unusual in the consistency with which properties have been coming to the market. Traditionally the quieter months are Jan, Feb, Jul, Aug, Nov and Dec. as seen in 2023. Whilst we have not seen a ‘summer dip’, there was a decrease in October and this has continued into November. However with stamp duty increasing in April 2025 sellers may be rushing market their properties ahead of the changes, pushing the number of available properties higher than they might otherwise be.

SALES AGREED: Remained fairly consistent with the usual seasonal dips in August and December in 2023, surprisingly in 2024 we didn’t see the dip in August. This could coincide with interest rates beginning to fall, bringing a little optimism back to the market after 2 tough years. We are seeing numbers of transactions drop off as we near the end of the year but perhaps not as much as they might otherwise be due to a rush to beat the increase in stamp duty in April 2025.

PRICE REDUCTIONS: The number of price reductions increased markedly in November as agents push sellers to reduce in the hope of agreeing a sale agreed before the end of the year. Whilst this can sometimes pay off, Sales that do not exchange before Christmas can often “fall through” as buyers change their minds due to having too much time to think. There is a saying “time kills deals”. A good agent drives the conveyancing process to complete before something happens to derail it.

In my last market comment I wrote about how transaction levels had changed over the last 15 or so years. This month I decided to download the Land Registry data for the “South West”. As I looked at the numbers there were some noticeable shifts coinciding with global events. The graph below demonstrates the average number of monthly transactions in the South West and how they were impacted by global events.

In conclusion, the property market changed significantly and permanently after the financial crisis. Transaction levels dropped by 40% due to caution in lending from the banks and their more stringent stress testing of a borrower’s financial capability. Transaction levels did improve as time went by but was never more than about 80% of the pre-financial crises average.

More recently we had the post-Covid boom where the population re-imagined how they were living and how the home was used. The shift to remote working meant people needed an office, either in the house or in the garden and so there was a significant amount of up-sizing or relocation to cheaper areas.

Now we arrive at the current state of affairs! After the boom of the last two years a lull in activity was inevitable as buyers had brought their move forward. The post 2022 budget sent interest rates up to 5%+ resulting in transaction levels being lower now than even during the post financial crisis. This is evidenced by the number of available properties doubling whilst the sales agreed stays the same.

The era of cheap money is over, certainly for the foreseeable future. Wages are now increasing faster than inflation and house prices have stalled, meaning affordability remains OK for most. However there have been many people in the past couple of years (and an equal number over the next couple of years) who have come off sub 2% mortgage deals and on to 4%, 5% and in some cases even higher mortgage rates. It is testament to the post financial crisis stress testing that there have not been more forced sales but buyers purchasing power has been severely curtailed as monthly payments are significantly higher than they have been for the period between 2008/9 and 2022.

As always there are mixed signals for the market ahead, the members of the Institute of Directors were recently canvassed and their confidence levels for the economy going forward is lower than during the years after the financial crisis. Inflation is currently higher than the target at 2.7% meaning interest rate cuts are likely to be smaller than we had hoped for earlier in the year. The added N.I. costs mean that unemployment might increase a little and wage increases stall.

In 2024 the South West under performed compared to the rest of the country with prices sliding downwards gently compared to the national market with slightly higher average prices. There is a lack of confidence among businesses surveyed by the IOD, the budget has caused inflationary pressures and will likely keep interest rates from being cut as much as they might have been. I think unemployment might rise slightly and wages stagnate a little. But on the positive side, history shows us that people can only put their lives on hold for so long and after 2-3 years the market kicks on again as buyers return to the market having decided they can’t wait any longer.

Many agents have revised their 2025 predictions slightly from a 5% increase to a 4.5% nationally. If the South West performs as it has done in 2024 (i.e. 2.0%-3.0% below the national average) that would see a 1%-2% rise in 2025.

SUMMARY: There are a lot of properties that have been sitting on the market for months and months, some with some significant price reductions of 30% or more and others with no price reductions. In my experience if a property doesn’t sell within 3-4 months it is because it is too expensive in the current market. We don’t see prices increasing more than a percent or two next year and therefore sitting it out is not going to achieve anything and the property will just go stale. If you are currently on the market and not receiving any interest our advice is to couple a price reduction with a switch to a new agent. If you are thinking of coming to the market then consider pricing your property at the lower end of appraisals you receive because that is likely to be the most realistic.

I hope the above has been of interest to you and if you would like to see the source data, discuss how the market might affect your move or when might be the best time sell, I would be delighted to talk to you. I enjoy nothing more than analysing the stats and figures with people. It is all about stats and figures when it comes to property!

Monthly Market Insight, October 2024

Every month we chart the number of available properties, the number of new instructions, the number of sales agreed and the number of price reductions in our local area.

We use this data to work out how the numbers could: –

  • Affect someone’s decision to put their property on the market.
  • Affect how prices could move.
  • Determine the length of time it may take to sell.
  • Influence whether to price conservatively or ambitiously.

We compare the local market to the national one and use articles from different sources to put meat on the bones.

AVAILABLE PROPERTIES: Over the last 23 months the numbers of properties on the market have been steadily increasing. Dec ‘22 had 725 properties available and by Oct ‘24 that had increased to 1481, almost double. This has two effects, the first is that prices will fall, or certainly not increase, and secondly it will take longer to sell as buyers have more choice.

NEW INSTRUCTIONS: 2024 has been unusual in the consistency with which properties have been coming to the market. Normally there are quiet months in Jan, Feb, Jul, Aug, Nov and Dec. as seen in 2023. Whilst we have not seen the summer dip, I do note the drop in new instructions in Oct ‘24 and expect them to be even fewer in the last two months of the year.

SALES AGREED: These have remained consistent with the usual seasonal dips in August and December in 2023, surprisingly in 2024 we didn’t see the dip in August. This could coincide with interest rates beginning to fall, bringing a little optimism back to the market after 2 tough years.

PRICE REDUCTIONS: The number of price reductions over this period appears fairly stable. Increasing slightly in numbers before the quieter months of August and December as people become increasingly motivated to agree a sale ahead of these quieter periods.

The “new normal” a phrase coined after the financial crisis in 2007/8 when we saw annual property transactions drop from 1.4m in 2006 and 1.35m in 2007 down to 750,000 in 2008 nationwide.

The volume of transactions didn’t improve until 2014 resulting in 1.05m sales. The numbers stayed at this level until 2020, when Covid struck, but so swift was the reaction to lock-down that even though the first half of 2020 saw only 348,690 transactions the year still finished with a total of 888,290 sales!

Transactions increased to 1.26m in 2021 and decreased slightly in 2022 to 1.068m. It is therefore easy to understand how after 2 years of pre 2008 transaction levels, some homeowners are wondering why their properties aren’t selling.

With the data used in the above graph, I divided the number of sales agreed each month, by the available number of properties and multiplied by 100 resulting in the % of properties being sold. In 2024 it ranges from 8% to 13%. i.e. only 1 in 10 homes are going under offer. In 2023 that range was 6% to 17%.

Total sales agreed year to date in 2024 are 1573 whilst for the same 10 months in 2023 it was 1441, a smaller number but there were also fewer properties on the market so a greater proportion were being sold.

Everything we have talked about so far has been about the raw numbers; we haven’t mentioned what has been happening to house prices. Every month Rightmove, Halifax et al. talk about rising house prices, but the devil is in the detail. Rightmove quote “asking prices,” these are not the sold prices but a measure of both homeowners’ sentiment and the estate agents’ desperation to win the instruction by over-valuing.

There are no “local area” indices, but I receive updates from various sources and the following hit my inbox earlier today from Zoopla:

This certainly reflects what we have been seeing. A very mild softening of prices, properties remaining on the market for a long time due to overpricing, something some agents should be held accountable for as few are prepared to value realistically for fear of losing the instruction.

I hope the above has been of some interest to you and if you would like to see the source data, talk about how the market might affect your move or when might be the best time to sell, I would be delighted to talk to you. I enjoy nothing more than discussing the stats and figures, after all, it is all about the stats and figures when it comes to property!