2026 Market Commentary Year to Date
| GP Weston’s 2026 year-to-date property market report for South Somerset and North Dorset covers January to August 2026. It tracks house prices, sales agreed, new listings and price reductions across Sherborne, Yeovil, Wincanton, Castle Cary, Milborne Port and the villages in between, and explains how interest rates, mortgage costs and the Autumn Budget are shaping the local housing market. Eight months into 2026, the local market has gone through three distinct phases. The year started slowly: sales agreed in January and February were 10% down on 2025. Spring held up well, even though conflict broke out in the Middle East at the end of February: March to May produced 659 sales agreed, within 1% of last year’s strong spring. The summer is where the pressure showed. As energy prices and mortgage rates rose and a change of Prime Minister added political uncertainty, sales agreed from June to August fell 13% year on year. Taken together, the first eight months of 2026 produced 1,558 sales agreed in South Somerset and North Dorset. That is 7.6% fewer than in the same period of 2025, but 13.5% more than the 2023–2025 average for these months. There has been no shortage of sellers: 2,743 new instructions and an average of 1,842 homes on the market, 1.9% more than last year. The weakness is on the buyer side. On average, 10.6% of available homes went under offer each month, compared with 11.7% in 2025. In three of the eight months (January, February and June), the rate fell below 10%, which did not happen in any of the first eight months of 2025. |
| THE NATIONAL PICTURE | |||
| +1.6% UK annual house price growth (Nationwide, Aug) | 3.75% Bank of England base rate | 5.73% Average 2-year fixed mortgage (Moneyfacts, mid-Sept) | 3.1% UK CPI inflation (August 2026) |
| OUR LOCAL MARKET — SOUTH SOMERSET & NORTH DORSET | |||
| 1,558 Sales agreed, Jan–Aug (−8% YoY) | 2,743 New instructions (−4% YoY) | 1,797 Price reductions (−1% YoY) | 10.6% Of available homes went under offer each month |
Interest Rates, Mortgages & the UK Economy in 2026
Bank of England Interest Rates
The year began with Bank Rate at 3.75%, following a cut in December 2025, and with widespread expectations of further reductions in 2026. Those cuts have not come. The Bank of England has held rates at every meeting this year, and the debate has since turned. At both the July and September meetings, the Monetary Policy Committee voted 6–3 to hold. The three members who disagreed voted to raise rates to 4%. The Bank now expects inflation to rise to around 3¾% by the end of 2026 and slightly above 4% in early 2027, and it describes the risks as “tilted to the upside”.
Mortgage Rates in 2026
Swap rates, which lenders use to price fixed mortgages, have risen through the year, and mortgage rates have followed. According to Moneyfacts, the average two-year fixed rate was 4.84% on 1 March, 5.63% by 1 August and 5.73% by mid-September. The average five-year fix rose from 4.96% to 5.78%. In the first half of September alone, several major lenders, including NatWest, Santander, HSBC, Lloyds and TSB, raised their rates twice. Zoopla estimates that higher mortgage costs have reduced the typical buyer’s purchasing power by around 9% since January.
The Middle East Conflict, Energy Prices & Inflation
The single biggest event of the year has been the conflict in the Middle East, which began on 28 February and has disrupted shipping through the Strait of Hormuz, a route for around 30% of the world’s oil. Hopes of a settlement in June did not last. Since July, Brent crude and UK wholesale gas prices have risen by 36% and 78% respectively (Bank of England). CPI inflation rose to 3.1% in August from 2.9% in July, driven mainly by motor fuel, and owner-occupiers’ housing costs were up 3.9% on the year.
Economic Growth, Politics & the Autumn Budget
The economy has held up better than expected, with GDP growing 0.4% in the second quarter. The political landscape, however, has changed. Andy Burnham became Prime Minister on 20 July and appointed John Healey as Chancellor in place of Rachel Reeves. The first Budget under the new leadership is scheduled for 28 October. Stamp duty changes have been ruled out, but wider tax rises have not.
| “ This year there has been no shortage of sellers. What has been missing is buyers with the confidence to commit, and the cause is the cost of borrowing, not any loss of appeal for the West Country. GP WESTON |
UK Housing Market: 2026 So Far
UK House Prices
Nationally, prices have edged up rather than fallen. Nationwide recorded annual growth of 1.6% in August, with an average price of £275,465. The official UK House Price Index put the UK average at £273,000 in July, 1.4% higher than a year earlier, while Zoopla shows growth of 0.9%. Asking prices are 0.8% lower than a year ago (Rightmove, September), after what Rightmove described as a “particularly subdued” summer. The South West has lagged the national picture, with prices broadly flat on the year.
| Measure | Average price | Annual change |
| Nationwide HPI (August 2026) | £275,465 | +1.6% |
| ONS UK House Price Index (July 2026) | £273,000 | +1.4% |
| ONS — South West region (July 2026) | £302,298 | −0.2% |
| Zoopla HPI (August 2026) | £272,800 | +0.9% |
| Rightmove asking prices (September 2026) | £367,440 | −0.8% |
Sales Agreed, New Listings & Homes for Sale
Nationally, agreed sales are running 9% below last year (Rightmove), or 6% below according to Zoopla, which says the gap is starting to close. New listings are 3% down, yet the total number of homes for sale is at a 12-year high because fewer are selling. Buyer searches are 7% higher than a year ago, the strongest annual increase for 12 months (Zoopla). On average it takes 64 days to find a buyer and a further 150 days to complete. Rightmove found that 74% of homes sold in 2026 did so without needing a price reduction, which is a clear message for sellers about pricing correctly from the start.
South Somerset & North Dorset: House Prices & Market Data
Somerset and Dorset House Prices
The latest official figures, for July 2026, show the average price in Somerset up 3.1% over the year to £282,000, ahead of a broadly flat South West. Dorset was unchanged at £325,000. These figures are based on relatively few sales and reflect deals agreed several months earlier.
| Metric (ONS, July 2026) | Somerset | Dorset |
| Average price | £282,000 | £325,000 |
| Annual change | +3.1% | Little change |
| First-time buyer average | £232,000 | £254,000 |
| Home-mover average | £334,000 | £390,000 |
| Detached house average | £460,000 | £515,000 |
| Average private rent (August 2026) | £1,016 (+6.2%) | £1,056 (+4.9%) |
How Many Homes Have Sold in 2026? Our Local Market Data
Every month we record available stock, new instructions, sales agreed and price reductions from Rightmove across 24 postcodes in South Somerset and North Dorset, covering homes priced between £200,000 and £10 million. Because this data reflects what is happening now, it gives an earlier signal than the house price indices.
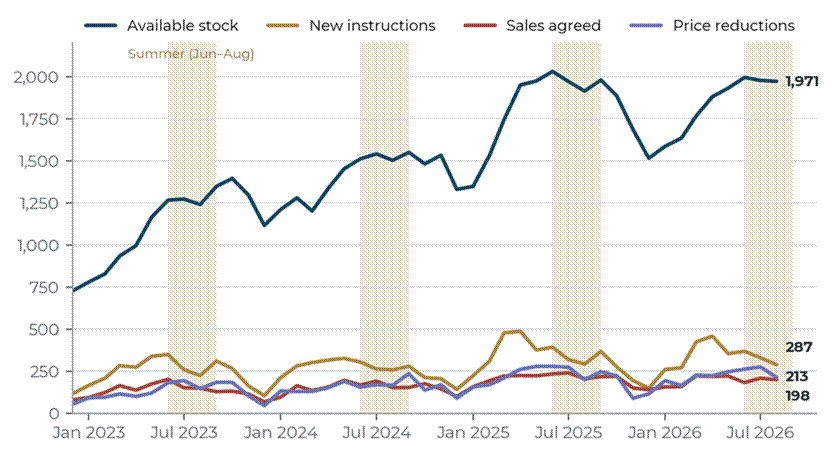
Monthly market activity since we began tracking, December 2022 – August 2026. Summer months are shaded. Source: GP Weston analysis of Rightmove data.
| January – August | 2023 | 2024 | 2025 | 2026 | 2026 vs 2025 | 2026 vs 2023–25 avg |
| Average available stock | 1,059 | 1,379 | 1,807 | 1,842 | +1.9% | +30.2% |
| New instructions | 2,091 | 2,251 | 2,868 | 2,743 | −4.4% | +14.1% |
| Sales agreed | 1,184 | 1,247 | 1,686 | 1,558 | −7.6% | +13.5% |
| Price reductions | 1,034 | 1,213 | 1,817 | 1,797 | −1.1% | +32.7% |
| Sales agreed as % of stock | 14.0% | 11.3% | 11.7% | 10.6% | −1.1 pts | −1.7 pts |
| Price reductions as % of stock | 12.2% | 11.0% | 12.6% | 12.2% | −0.4 pts | +0.3 pts |
| New instructions per sale agreed | 1.77 | 1.81 | 1.70 | 1.76 | +0.06 | 0.00 |
| Months with sales rate below 10% | 0 | 1 | 0 | 3 | +3 | — |
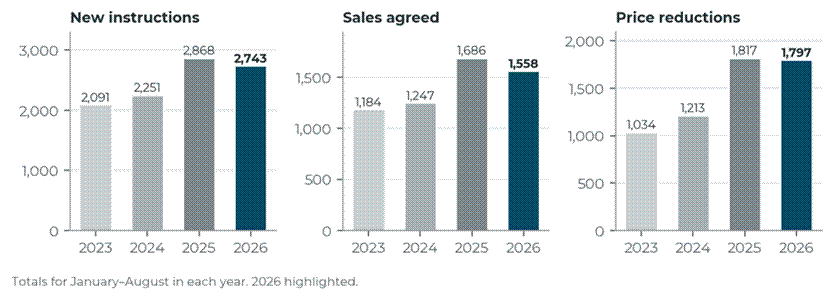
January–August totals by year. Source: GP Weston analysis of Rightmove data.
The long-term picture is still healthier than 2023 and 2024. Compared with the average of the previous three years, this year has brought more sellers (+14%), more sales (+13.5%) and far more homes on the market (+30%). Comparisons with 2025 look weaker mainly because 2025 was the strongest year in our dataset.
But supply is growing faster than demand. Stock has risen by nearly a third on the three-year average while sales have risen by about an eighth, so each home competes with more alternatives. That is why the sales rate, the share of available homes going under offer each month, has fallen to 10.6%, the lowest figure for January to August in the four years we have tracked. Price reductions are up by a third on the three-year average.
The 2026 Property Market in Three Phases
| Period | Sales agreed 2026 | Sales agreed 2025 | Change | New instr. change | Sales rate 2026 | Sales rate 2025 |
| Jan – Feb | 313 | 348 | −10.1% | −0.4% | 9.7% | 12.1% |
| Mar – May | 659 | 664 | −0.8% | −7.9% | 11.8% | 11.7% |
| Jun – Aug | 586 | 674 | −13.1% | −1.7% | 9.9% | 11.4% |
| Jan – Aug | 1,558 | 1,686 | −7.6% | −4.4% | 10.6% | 11.7% |
A slow start. January and February brought almost exactly the same number of new instructions as 2025 (528 against 530) but 10% fewer sales, with more stock carried over from the end of 2025. February’s sales agreed (157) were 18% below February 2025.
A resilient spring. Despite the outbreak of conflict at the end of February, March to May produced 659 sales agreed, within 1% of 2025. Fewer new instructions (−8%) kept stock under control, and the sales rate of 11.8% was slightly ahead of last spring.
A difficult summer. Sales agreed fell 13% between June and August. June was the low point, with 181 sales and a 9.1% sales rate. By August, sales were back within 3% of last year’s level. Price reductions outnumbered sales agreed in every summer month.
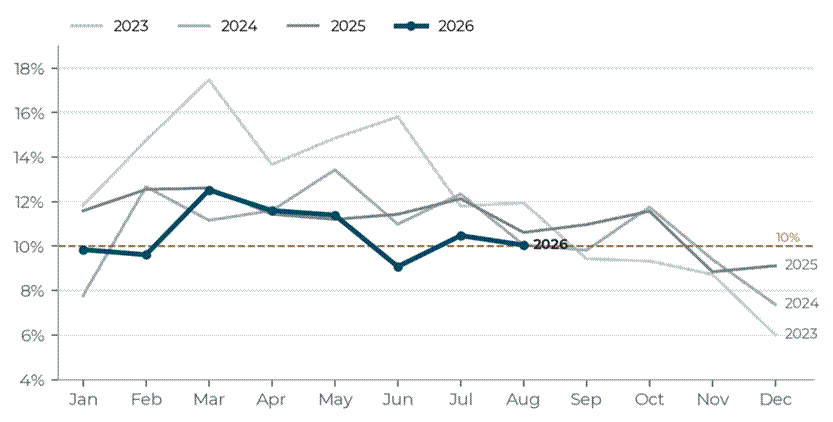
Sales agreed as a percentage of available stock, by month and year. The dashed line marks 10%. Source: GP Weston analysis of Rightmove data.
| Month (2026) | Available | New instr. | Sales agreed | Reductions | Sales rate | Sales agreed vs 2025 |
| January | 1,585 | 259 | 156 | 192 | 9.8% | 0% |
| February | 1,634 | 269 | 157 | 164 | 9.6% | −18% |
| March | 1,765 | 422 | 221 | 225 | 12.5% | 0% |
| April | 1,880 | 457 | 218 | 223 | 11.6% | −2% |
| May | 1,931 | 353 | 220 | 245 | 11.4% | 0% |
| June | 1,994 | 367 | 181 | 261 | 9.1% | −22% |
| July | 1,977 | 329 | 207 | 274 | 10.5% | −13% |
| August | 1,971 | 287 | 198 | 213 | 10.0% | −2% |
The Premium Rural Property Market
Higher mortgage rates hit hardest where borrowing is largest relative to the price. Equity-rich buyers, often moving from London and the South East or downsizing, are less exposed, and South Somerset and North Dorset continue to appeal to them: the landscape, the schools, the A303 and the Castle Cary line to London. The pattern we have described before still holds: homes that are well presented and realistically priced find buyers, while those launched at aspirational prices are the ones that end up in the reduction figures.
Stamp Duty & the Autumn Budget 2026
Stamp duty thresholds have not changed since April 2025, when the nil-rate band fell back to £125,000 and first-time buyer relief to £300,000 (on purchases up to £500,000). The Prime Minister has said there will be no stamp duty changes at the October Budget, which removes one reason for buyers to wait.
The main property tax already announced is the High Value Council Tax Surcharge, an annual charge on homes in England worth £2 million or more. It is due to start in April 2028, at £2,500 a year and rising to £7,500 for homes worth £5 million or more. It affects only a small number of properties in our area. With a new Chancellor who will not rule out broader tax rises, we expect some hesitation until 28 October. Once the Budget is out of the way, the run into the new year should be clearer.
Property Market Outlook for the Rest of 2026
Four months of 2026 remain, and they usually include a busy autumn. In each of the last three years, more homes came to market in September than in August, and sales agreed held up through October before the usual winter slowdown. What happens this year depends heavily on factors outside the local market:
- Supply is plentiful. With stock close to record levels, buyers can be selective and will walk away from homes that look overpriced.
- Borrowing costs will decide the direction. If energy prices ease and swap rates fall back, mortgage pricing could improve quickly. If inflation climbs as the Bank expects, rates may stay near current levels into 2027.
- The Budget on 28 October is a near-term hurdle. With stamp duty ruled out, the effect should fall mainly on confidence rather than cost.
- Demand for West Country lifestyle property is intact. National buyer searches are up on last year, and equity-rich movers are less exposed to mortgage rates.
On current trends, we expect 2026 to end with fewer sales than 2025 but comfortably more than 2023 or 2024. For sellers, the lesson of the year so far is clear. In a market with this much choice, homes that launch at the right price sell, and homes that launch too high end up among the reductions.
At GP Weston, we believe that in a market with fewer sales but motivated buyers, the quality of the agent matters more than ever. The sellers who achieve the results they want are those who commit to professional photography and drone footage, proactive buyer matching, honest pricing advice and a single experienced point of contact throughout. These are the hallmarks of what we offer.
| “ Modern service and ideas with traditional values. In any market, that is the formula that works. GP WESTON |
Selling in Somerset or Dorset: Your Questions Answered
How is the Somerset and Dorset property market performing in 2026?
More slowly than 2025, but ahead of 2023 and 2024. Across our 24 postcodes in South Somerset and North Dorset, 1,558 sales were agreed from January to August 2026. That is 7.6% fewer than the same period of 2025 but 13.5% more than the 2023–2025 average. Spring held up well; the summer was weaker as mortgage rates rose.
How many homes are for sale in South Somerset and North Dorset?
Around 1,970 homes priced from £200,000 were on the market in our 24 postcodes in August 2026, 3% more than a year earlier and close to the record 2,030 of June 2025. On average, just over one in ten of them went under offer each month.
What is the average house price in Somerset and Dorset?
According to the ONS, the average price in Somerset was £282,000 in July 2026, up 3.1% on the year. In Dorset it was £325,000, unchanged on the year. Detached homes averaged £460,000 in Somerset and £515,000 in Dorset.
What will happen to house prices for the rest of 2026?
Nobody can promise a direction, but the evidence points to a flat, price-sensitive market rather than a fall. National prices are still rising slightly (Nationwide +1.6% in August), the South West is broadly flat, and the swing factor is mortgage rates. If energy prices ease and swap rates fall, activity should pick up quickly; if inflation climbs as the Bank of England expects, conditions are likely to stay as they are into 2027.
Will stamp duty change in the October 2026 Budget?
The Prime Minister has said there will be no stamp duty changes at the Budget on 28 October 2026. The current thresholds, in place since April 2025, remain: a £125,000 nil-rate band for home movers and £300,000 for first-time buyers on purchases up to £500,000.
About GP Weston, Estate Agents in Somerset & Dorset
GP Weston is an independent, boutique estate agency founded by James Weston and Jessica Grant Peterkin, both raised in Somerset and Dorset and each with over two decades of experience in the London and West Country property markets. Having worked for leading agencies including John D Wood, Hampton’s International, and prime Central London boutiques, James and Jessica returned to their West Country roots to offer something genuinely different: a client-first, relationship-based service free from corporate targets and red tape.
GP Weston handles residential sales and lettings across South Somerset, North Dorset, and West Dorset, and maintains connections to the London market through a curated London Properties offering. The firm makes full use of the latest technology — including drone footage, professional staging advice, and social media distribution — to present properties to the widest possible audience.
Disclaimer: This report is produced for general information purposes only and does not constitute financial, legal, or investment advice. Local market figures are GP Weston’s analysis of Rightmove data for 24 postcodes in South Somerset and North Dorset (all property types, £200,000–£10,000,000). Year-to-date figures compare January–August in each year. National and economic data is sourced from publicly available sources including the Bank of England, ONS, HM Land Registry, Nationwide, Rightmove, Zoopla and Moneyfacts, and is correct to the best of our knowledge at the date of publication (September 2026). GP Weston Ltd is registered in England and Wales.