SOMERSET AND DORSET HALF-YEAR MARKET REPORT, H1 2026
Executive Summary
The story in this footprint tracks the national “more choice, softer demand” narrative closely, with some local nuance. Comparing market activity in Somerset and Dorset in H1 2026 (January–June) against H1 2025:
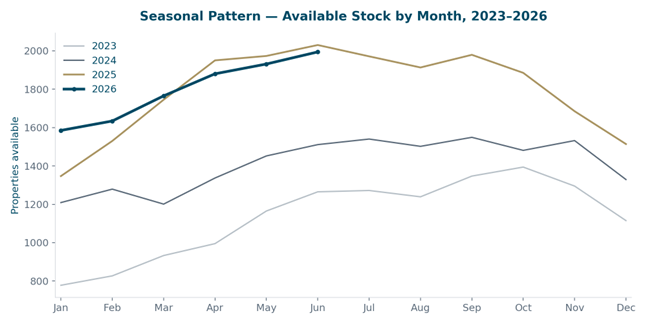
- Available stock in South Somerset and North Dorset averaged 1,798 properties on the market across H1 2026, up 2% on H1 2025’s average of 1,762 — though the single highest month in the whole series remains June 2025 (2,030), so 2026 has not broken new ground on peak stock, only on the half-year average.
- New instructions totalled 2,127 across the half, down 6% on H1 2025’s 2,259.
- Sales agreed totalled 1,153, down 7% on H1 2025’s 1,244.
- The conversion rate (sales agreed as a % of available stock) averaged 10.7%, down from 11.8% — buyers have more choice, but are converting less of it.
- Price reductions ran at 12.1% of stock, only marginally below last year’s 12.6% — sellers are still adjusting expectations, but not dramatically more than usual.
Set against a four-year run of data, this H1 sits well above the 2023 and 2024 norms on every stock and activity measure, but growth in listings and sales has clearly plateaued after the sharp run-up between 2023 and 2025 — see the year-on-year comparison later in this report.
The Local Market, Visualised
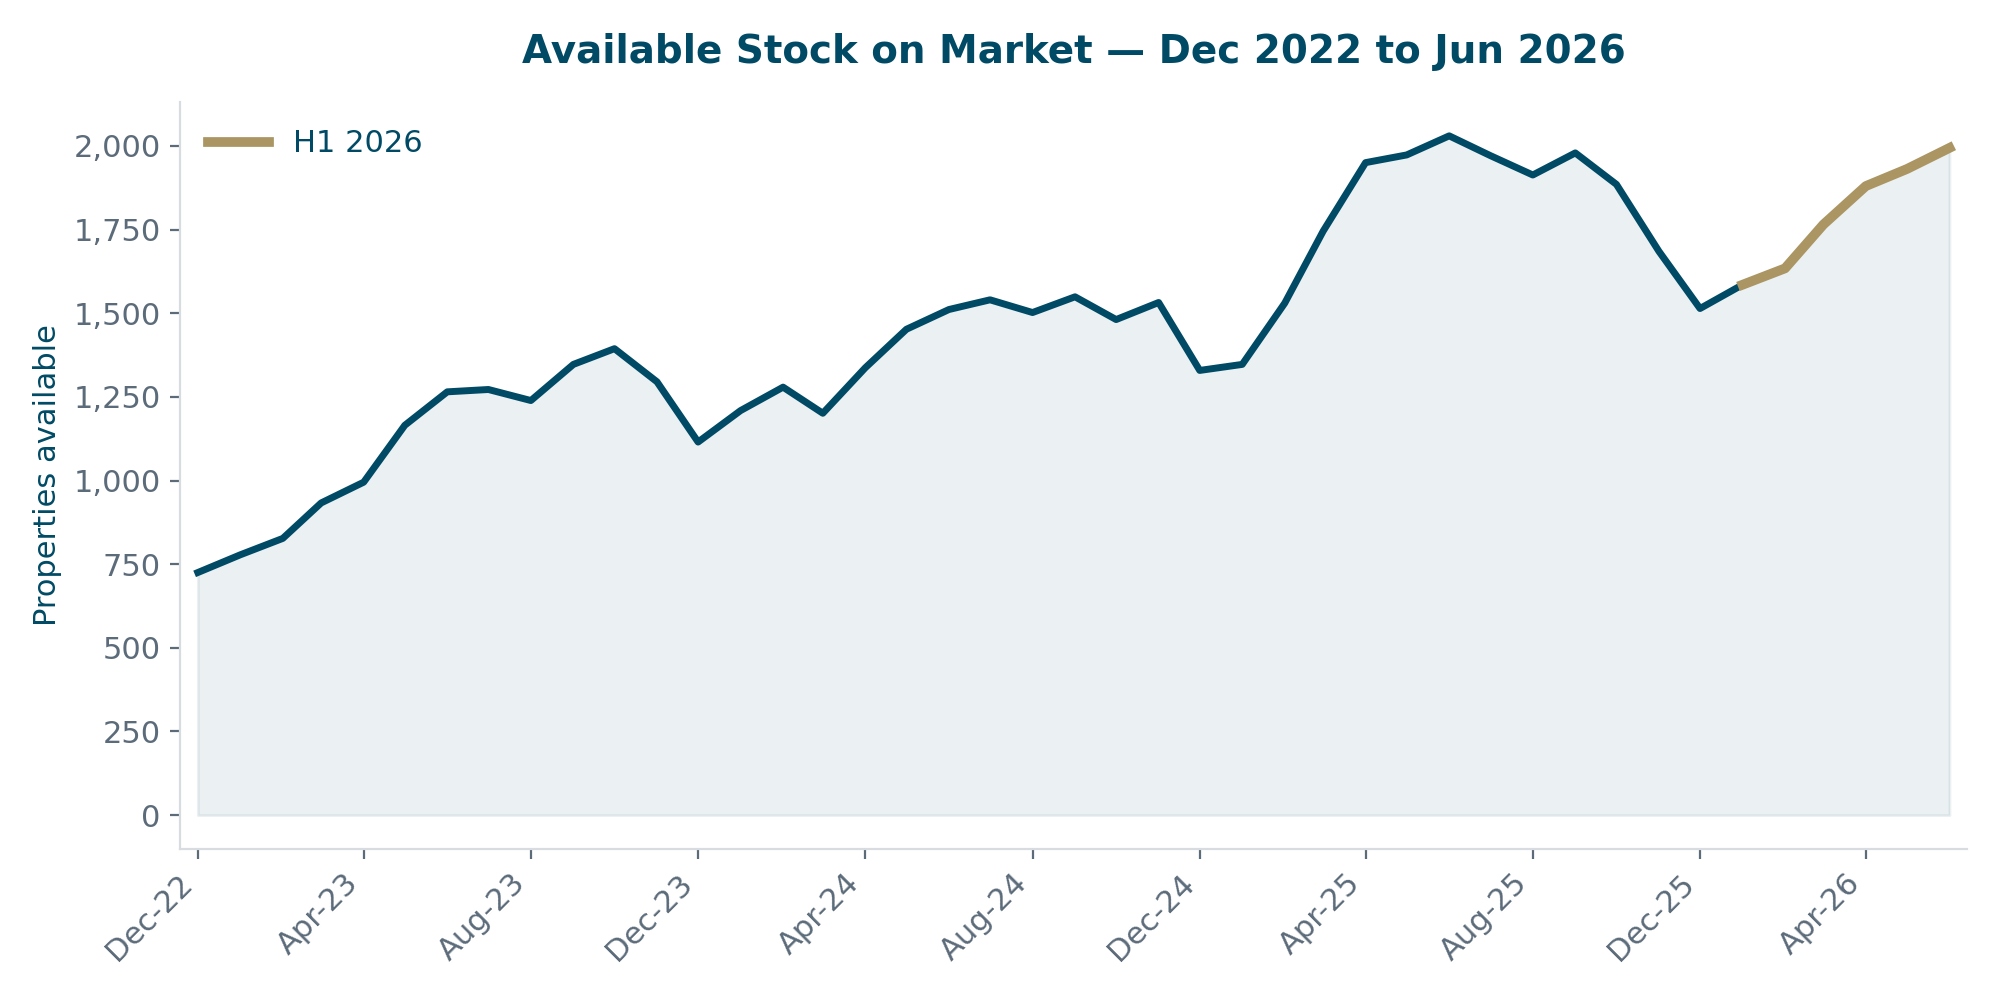
Available stock has climbed steadily since late 2022 and plateaued through H1 2026, tracking just below the mid-2025 peak.
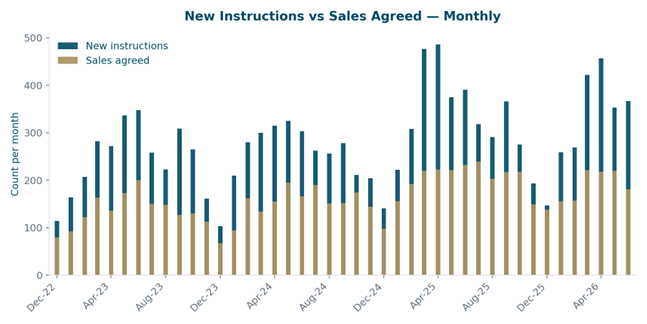
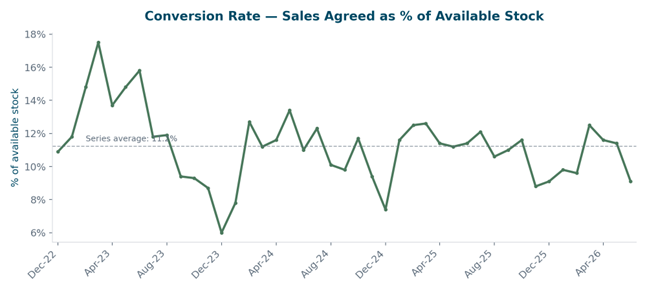
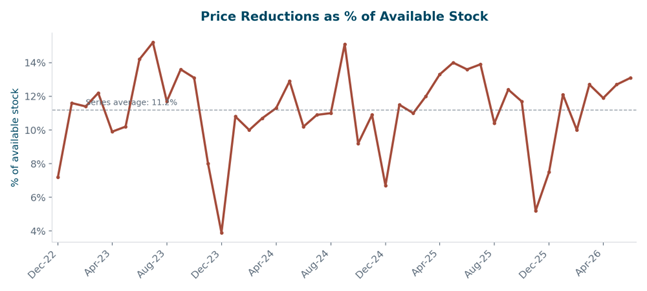
Half-Year Snapshot: H1 2026 vs H1 2025
| 1,798 Avg. Available Stock +2% vs H1 2025 (1,762) | 2,127 New Instructions -6% vs H1 2025 (2,259) | 1,153 Sales Agreed -7% vs H1 2025 (1,244) | 10.7% Avg. Conversion Rate vs 11.8% in H1 2025 |
Year-on-Year Comparison, 2023–2026
Overlaying four consecutive H1 periods shows how far the market has moved since the tight, low-stock conditions of early 2023 — and that the growth in supply and activity has clearly levelled off over the last twelve months.
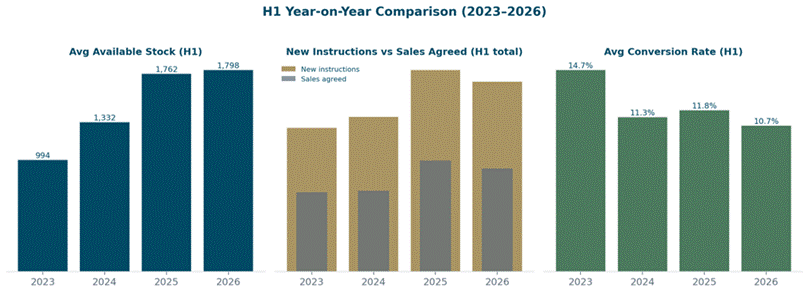
H1 average stock has more than doubled since 2023; conversion rates have fallen every year over the same period.
The National and Regional Backdrop
This pattern of rising stock in and around Sherborne, Bruton, and the wider Blackmore Vale, and softer conversion, mirrors what is happening right across the country.
Supply at record highs, demand cooling
TwentyCI’s data shows 794,000 homes were newly listed for sale nationally in the first five months of 2026, up 2.7% on the same period in 2025 and the highest level in their series. Over the same period, properties moving to sale agreed fell 4.1% year-on-year, and TwentyCI has revised its full-year 2026 transaction estimate down from 1.2 million to 1.13 million, citing softer mortgage demand and geopolitical uncertainty. Its most recent monthly cut showed agreed sales down 8.1% in May alone.
Prices: broadly flat, with a soft June
Rightmove’s national House Price Index recorded a 0.6% (–£2,113) fall in asking prices in June 2026, the biggest June drop in fourteen years, as high supply, more price-sensitive buyers and an early summer slowdown weighed on the market. Zoopla’s June index paints a steadier picture on completed prices — up 1.4% year-on-year nationally — but confirms sales agreed are running about 7% below last year and buyer enquiries down around 15%, with the South West named as one of the softer-performing regions on transaction volume even though local prices have held up reasonably well.
What this means for Somerset and Dorset
The ONS/Land Registry index put the average Dorset house price at £326,000 in April 2026 and Somerset at £277,000, both broadly in line with a year earlier. Savills, meanwhile, has downgraded its 2026 UK house price forecast to –2% amid higher mortgage rates, with the biggest falls expected in London and the South East — it expects the North of England, Scotland and Wales to be the most resilient over the next few years, while southern regions see houses continue to outperform flats.
Interest Rates and Global Events — What’s Been Driving This
H1 2026 has been shaped by one dominant macro story: rate and inflation volatility driven by conflict in the Middle East.
- The Bank of England cut its base rate to 3.75% in December 2025 and held it there through every meeting since, including June 2026. The next decision is due 30 July 2026, with forecasters split on whether it holds again or moves.
- Escalating conflict in the Middle East pushed Brent crude from around $100 a barrel to briefly above $126, with repeated disruption around the Strait of Hormuz. That fed straight into inflation and mortgage pricing: CPI rose from 3.0% in February to a 2026 peak of 3.3% in March, before easing back to 2.8% by April and holding there into July.
- Average two-year fixed mortgage rates, which started the year below 5%, rose sharply through March and April on the back of the conflict and swap-rate volatility — trackers put the peak anywhere from the mid-5% range to as high as 5.8% in May — before easing gradually through June as tensions and oil prices partially stabilised.
- Layered on top of the rate story is continued adjustment to the Autumn Budget 2025 mansion tax (formally the High Value Council Tax Surcharge on homes worth over £2 million, announced 26 November 2025), which is already influencing pricing and seller behaviour at the top of the market, particularly in London and the South East. Analysis has found roughly 8,800 fewer £2 million-plus homes on the market in England since it was announced, as some owners hold back and others move quickly to get ahead of any future changes.
This rate and inflation volatility is the single biggest reason local conversion rates dipped even as stock kept climbing: buyers who had been expecting cheaper mortgages through early 2026 suddenly faced a less favourable borrowing environment, and many paused. This footprint’s £300k+ average price point sits well below the mansion tax threshold, but is not immune to the broader caution it has introduced into the market.
Sources: Bank of England; ONS Consumer Price Inflation releases; TwentyCI Property & Homemover Report; Mortgage Finance Gazette; Rightmove House Price Index; Zoopla House Price Index; Savills UK Housing Market Update; HomeOwners Alliance; Chase de Vere; House of Commons Library.
What This Means for Vendors Right Now
- Stock at multi-year highs means presentation and pricing matter more than ever. With more choice available to buyers than for most of this data series, overpriced or poorly presented homes will simply sit.
- Realistic pricing from day one beats a reduction later. Price reductions running at 12%+ of stock is consistent with the national picture, and properties priced right from the outset are converting faster in a market where buyer patience is thinner.
- This is rate volatility, not a housing crash. Local house prices have held up reasonably well through H1 2026 — this is a market adjusting to a bumpy borrowing environment, not a demand collapse.
- Keep an eye on 30 July. The next Bank of England rate decision, and any signal on the path of mortgage rates into autumn, is likely to be the next meaningful catalyst for buyer confidence in this market.
This report was prepared using locally filtered Rightmove listings data (target area, £200k–£100,000,000, all property types) alongside publicly available national and regional data. Figures for July 2026 onward were not yet available at the time of writing.